
Conferences are a great opportunity to get the word out about your research and show what an engaging, effective teacher you can be. Along those lines, here are a few tips for writing, designing, and presenting a top-notch conference talk.
Writing Your Talk
Conference talks are typically 10-15 minutes long. I’d suggest breaking it down like this:
- background/justification (2 min)
- research goals/questions (1 min)
- study design/methods (2 min)
- overview (1 min)
- findings (5-7 min)
- discussion/implications (1-2 min)
Keep the focus on your paper. Save the bulk of your time to talk about your study and what you find. People aren’t coming to your talk to hear about what’s been done before. They’re coming to hear what’s new. (Though, if your talk is at 8am, they’re probably not coming at all).
If you’re nervous about rambling or freezing up, it's okay to script your talk. BUT:
- write it like you’d say it (use short, declarative sentences)
- aim for 100-150 words per minute (any more than that and you'll have to speed-read)
- print it out 14pt font or bigger (any smaller and you'll struggle to see it)
- practice it aloud (and edit, edit, edit)
- keep practicing until you’re confident (but bring your script, just in case)
- try to stay eyes-up as much as possible, and don't forget to breathe
When it comes to the background section of your talk, don’t just summarize the literature - make a case for your study, instead. What’s the gap or puzzle or problem in the literature? What does existing research suggest in terms of solutions? How will you examine/test those possibilities?
When it comes to methods – make a case for your study design. Why is your case/sample/dataset the right one for your research question? Why is your method the right method? (Note: aim higher than “because no one has looked at this before”)
Don’t bury the lead. State your central argument clearly, up-front. Briefly summarize the key patterns in your data that support your argument. Then unpack those patterns with evidence (e.g., fieldnote excerpts, quotes, figures, tables, etc.). Then re-state your conclusion.
A few notes on choosing quotes/fieldnotes to include in your talk. Choose examples that:
- don’t require a lot of backstory/context to understand
- are relatively short (easier to follow)
- illustrate a single point (that way you won’t mislead your audience)
When presenting qualitative data, “sandwich” your quotes/fieldnote excerpts:
- state your point
- describe the pattern that supports your point
- introduce the quote/excerpt
- read the quote/excerpt
(and don't be afraid to act it out - if they wave/frown/shout, you wave/frown/shout) - explain how the quote/excerpt illustrates your point
End by answering the “so what” question. What should we take away from these findings? How do they build on/challenge/contribute to existing research? What implications do they have for policy/practice? What are the next steps?
Mind your manners. Leave time to thank the session organizer (the person who picked your paper for a talk), the presider (the person who introduced you/kept time), the discussant (the person offering comments on the paper), and the audience.
Anticipate questions. It’s okay if you don’t have time to cover everything in your paper. That leaves a clear opening for questions. Turn those possible questions into extra slides, or at least prep a few notes about each topic.
Designing Your Slides
A few notes on designing effective, engaging slides:
- give each slide a clear purpose
- summarize key points; don’t write it all out
- only use 24pt font or larger for text
- shapes with text >>> bullet points
- avoid putting quotes/fieldnote excerpts on the slide
- figures >>> simple tables >>> detailed tables
- use images to illustrate key points

A few notes on finding and selecting images for your slides:
- go with the highest resolution you can find
(if it looks blurry in presentation mode, it'll be *really* blurry big-screen) - find images labeled for reuse, or take your own
(you can find free, free-use images at sites like freeimages, pixabay, etc.) - mix up the layouts; try some full screen images with text shapes on top

When presenting qualitative data, you want your slides to illustrate the fieldnote/quote you'll use as evidence. Find an image that sets the scene. And avoid putting your fieldnote/quote on the slide. Your audience can read a quote faster (in their heads) than you can read it (aloud). And that means they'll beat you to the punch(line). If you really want to include quotes, just choose a key phrase that highlights the main point of the example.
When presenting quantitative data, avoid making your audience do too much work. Figures are better than tables. But if you must include a table, keep it as simple as possible. And whether you opt for figures or tables or text, walk your audience, step by step, through what you find. And show them where to see those findings on your slide. Animations that put a box or circle around key data points can also be very effective for helping the audience follow along.
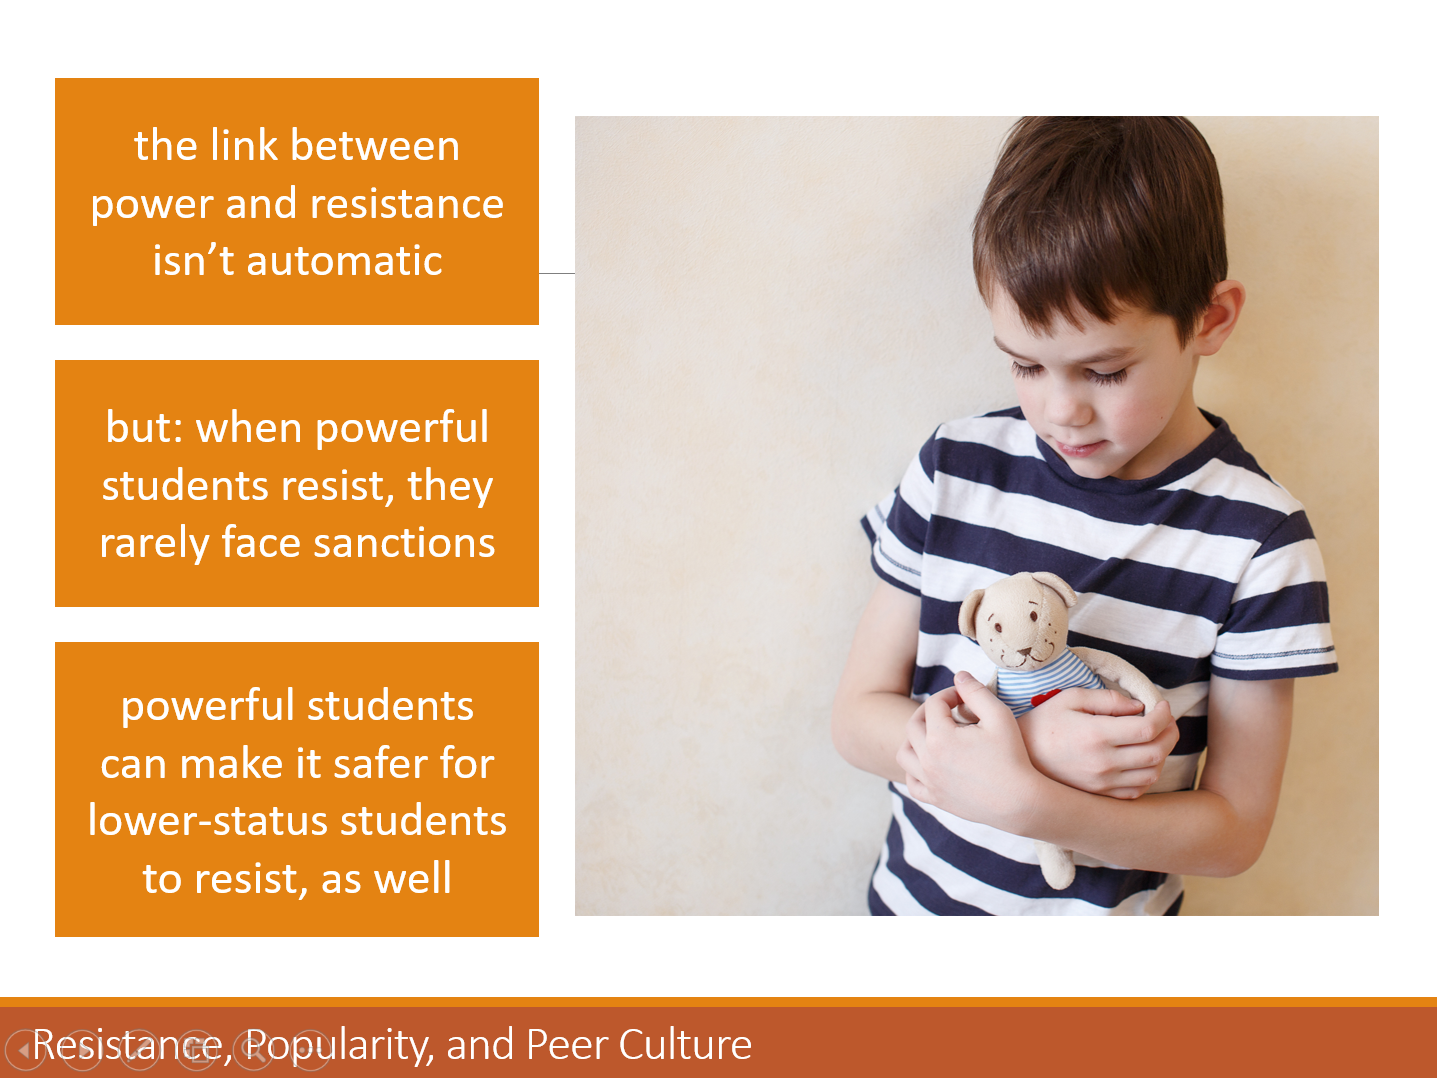
If you want to see what a conference talk looks like all put together, check out the draft slides for my talk, “Gender (Re)Play: Power and Children’s Resistance to Cultural Stereotypes” which I'll be presenting at the American Sociological Association's 2018 Annual Meeting in Philadelphia.
If it wasn't already obvious, I really enjoy conference talks. As someone who (very briefly) considered art school, I love designing slides. And as a former drama geek, I love the performance-art aspect of presenting. But despite all that, I still get butterflies. And that’s okay.